GPT Image 2 Infographic Visualization Design: Data-Driven UI Graphics
{ "type": "complex urban systems atlas infographic", "style": "{argument name=\"color palette\" default=\"dark background with glowing blue, go...
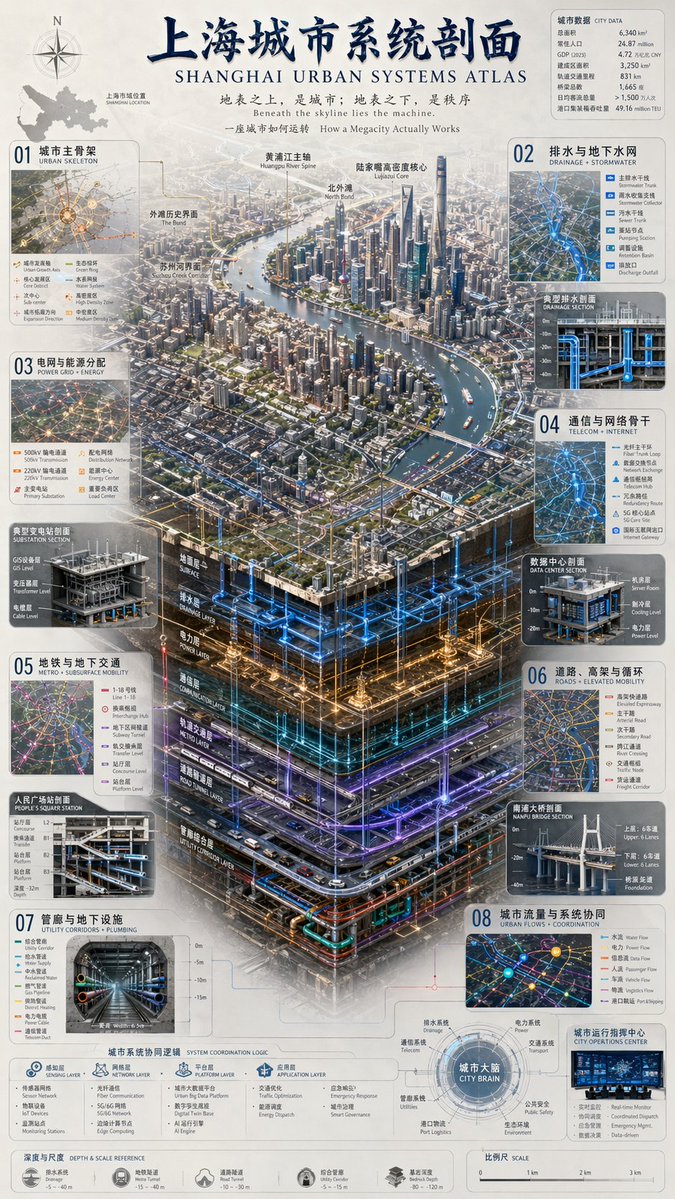
Generated result using this prompt
The Prompt
{
  "type": "complex urban systems atlas infographic",
  "style": "{argument name=\"color palette\" default=\"dark background with glowing blue, gold, and purple accents\"}, highly detailed technical illustration, 3D isometric cutaway",
  "header": {
    "title": "{argument name=\"chinese city name\" default=\"上海\"}城市系统剖面 {argument name=\"english city name\" default=\"SHANGHAI\"} URBAN SYSTEMS ATLAS",
    "subtitles": [
      "地表之上,是城市;地表之下,是秩序 {argument name=\"english subtitle\" default=\"Beneath the skyline lies the machine.\"}",
      "一座城市如何运转 How a Megacity Actually Works"
    ]
  },
  "layout": {
    "top_left": "Compass rose and city map labeled '上海市域位置 SHANGHAI LOCATION'",
    "top_right": "Data table titled '城市数据 CITY DATA' with 7 rows of statistics",
    "centerpiece": {
      "description": "{argument name=\"centerpiece style\" default=\"highly detailed 3D isometric cutaway render\"} of a megacity river landscape",
      "layers": [
        "地面层 SURFACE",
        "排水层 DRAINAGE LAYER",
        "电力层 POWER LAYER",
        "通信层 COMMUNICATION LAYER",
        "轨道交通层 METRO LAYER",
        "道路隧道层 ROAD TUNNEL LAYER",
        "管廊综合层 UTILITY CORRIDOR LAYER"
      ]
    },
    "side_panels": [
      { "id": "01", "title": "城市主骨架 URBAN SKELETON", "elements": "Map with 8 legend items" },
      { "id": "02", "title": "排水与地下水网 DRAINAGE + STORMWATER", "elements": "Cross-section diagram '典型排水剖面 DRAINAGE SECTION' with 5 legend items" },
      { "id": "03", "title": "电网与能源分配 POWER GRID + ENERGY", "elements": "Cross-section diagram '典型变电站剖面 SUBSTATION SECTION' with 6 legend items" },
      { "id": "04", "title": "通信与网络骨干 TELECOM + INTERNET", "elements": "Cross-section diagram '数据中心剖面 DATA CENTER SECTION' with 6 legend items" },
      { "id": "05", "title": "地铁与地下交通 METRO + SUBSURFACE MOBILITY", "elements": "Cross-section diagram '人民广场站剖面 PEOPLE'S SQUARE STATION' with 6 legend items" },
      { "id": "06", "title": "道路、高架与循环 ROADS + ELEVATED MOBILITY", "elements": "Cross-section diagram '南浦大桥剖面 NANPU BRIDGE SECTION' with 6 legend items" },
      { "id": "07", "title": "管廊与地下设施 UTILITY CORRIDORS + PLUMBING", "elements": "Cross-section diagram '综合管廊 UTILITY CORRIDOR' with 8 legend items" },
      { "id": "08", "title": "城市流量与系统协同 URBAN FLOWS + COORDINATION", "elements": "Map diagram '城市运行指挥中心 CITY OPERATIONS CENTER' with 6 legend items" }
    ],
    "bottom_panels": {
      "system_logic": {
        "title": "城市系统协同逻辑 SYSTEM COORDINATION LOGIC",
        "steps": 4,
        "labels": ["感知层 SENSING LAYER", "网络层 NETWORK LAYER", "平台层 PLATFORM LAYER", "应用层 APPLICATION LAYER"]
      },
      "city_brain": {
        "title": "城市大脑 CITY BRAIN",
        "central_node": 1,
        "peripheral_nodes": 8
      },
      "references": {
        "depth_scale": { "title": "深度与尺度 DEPTH & SCALE REFERENCE", "icons": 5 },
        "map_scale": { "title": "比例尺 SCALE", "markers": 4 }
      }
    }
  }
}
GPT Image 2 Infographic Visualization Design: Data-Driven UI Graphics
This GPT Image 2 prompt is from the awesome-gpt-image-2 collection.
Prompt
{ “type”: “complex urban systems atlas infographic”, “style”: “{argument name=“color palette” default=“dark background with glowing blue, gold, and purple accents”}, highly detailed technical illustration, 3D isometric cutaway”, “header”: { “title”: “{argument name=“chinese city name” default=“上海”}城市系统剖面 {argument name=“english city name” default=“SHANGHAI”} URBAN SYSTEMS ATLAS”, “subtitles”: [ “地表之上,是城市;地表之下,是秩序 {argument name=“english subtitle” default=“Beneath the skyline lies the machine.”}”, “一座城市如何运转 How a Megacity Actually Works” ] }, “layout”: { “top_left”: “Compass rose and city map labeled ‘上海市域位置 SHANGHAI LOCATION’”, “top_right”: “Data table titled ‘城市数据 CITY DATA’ with 7 rows of statistics”, “centerpiece”: { “description”: “{argument name=“centerpiece style” default=“highly detailed 3D isometric cutaway render”} of a megacity river landscape”, “layers”: [ “地面层 SURFACE”, “排水层 DRAINAGE LAYER”, “电力层 POWER LAYER”, “通信层 COMMUNICATION LAYER”, “轨道交通层 METRO LAYER”, “道路隧道层 ROAD TUNNEL LAYER”, “管廊综合层 UTILITY CORRIDOR LAYER” ] }, “side_panels”: [ { “id”: “01”, “title”: “城市主骨架 URBAN SKELETON”, “elements”: “Map with 8 legend items” }, { “id”: “02”, “title”: “排水与地下水网 DRAINAGE + STORMWATER”, “elements”: “Cross-section diagram ‘典型排水剖面 DRAINAGE SECTION’ with 5 legend items” }, { “id”: “03”, “title”: “电网与能源分配 POWER GRID + ENERGY”, “elements”: “Cross-section diagram ‘典型变电站剖面 SUBSTATION SECTION’ with 6 legend items” }, { “id”: “04”, “title”: “通信与网络骨干 TELECOM + INTERNET”, “elements”: “Cross-section diagram ‘数据中心剖面 DATA CENTER SECTION’ with 6 legend items” }, { “id”: “05”, “title”: “地铁与地下交通 METRO + SUBSURFACE MOBILITY”, “elements”: “Cross-section diagram ‘人民广场站剖面 PEOPLE’S SQUARE STATION’ with 6 legend items” }, { “id”: “06”, “title”: “道路、高架与循环 ROADS + ELEVATED MOBILITY”, “elements”: “Cross-section diagram ‘南浦大桥剖面 NANPU BRIDGE SECTION’ with 6 legend items” }, { “id”: “07”, “title”: “管廊与地下设施 UTILITY CORRIDORS + PLUMBING”, “elements”: “Cross-section diagram ‘综合管廊 UTILITY CORRIDOR’ with 8 legend items” }, { “id”: “08”, “title”: “城市流量与系统协同 URBAN FLOWS + COORDINATION”, “elements”: “Map diagram ‘城市运行指挥中心 CITY OPERATIONS CENTER’ with 6 legend items” } ], “bottom_panels”: { “system_logic”: { “title”: “城市系统协同逻辑 SYSTEM COORDINATION LOGIC”, “steps”: 4, “labels”: [“感知层 SENSING LAYER”, “网络层 NETWORK LAYER”, “平台层 PLATFORM LAYER”, “应用层 APPLICATION LAYER”] }, “city_brain”: { “title”: “城市大脑 CITY BRAIN”, “central_node”: 1, “peripheral_nodes”: 8 }, “references”: { “depth_scale”: { “title”: “深度与尺度 DEPTH & SCALE REFERENCE”, “icons”: 5 }, “map_scale”: { “title”: “比例尺 SCALE”, “markers”: 4 } } } } }
Category
Charts Infographics
Source: awesome-gpt-image-2
Share This Prompt
Prompt Info
Tags
Daily Prompt Updates
New prompts are automatically curated daily from top AI creators on X.