🎬 Seedance 2.0 Global API is now live
No real-person verification required No queues - instant generation Welcome to try it now → No real-person verification required No queues - instant generation Welcome to try it now →

Prompt Lib

Curated AI prompts for stunning image and video generation. Updated daily from top creators.

Auto-curated from X

Filter by Type:

Filter by Model:

GPT Image 2 Infographic Visualization Design: Data-Driven UI Graphics
image
GPT Image 2
Jul 5, 2026 awesome-gpt-image-2

GPT Image 2 Infographic Visualization Design: Data-Driven UI Graphics

{ "type": "medical infographic poster", "style": "highly detailed anatomical illustrations, clean structured layout, scientific diagrammatic st...

Prompt Preview

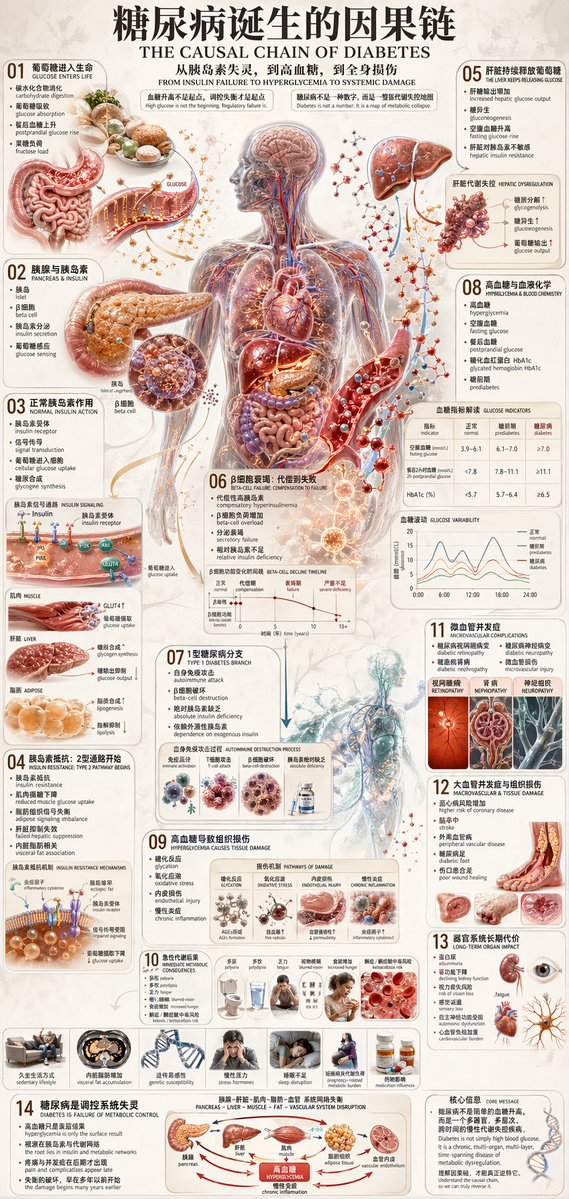
{ "type": "medical infographic poster", "style": "highly detailed anatomical illustrations, clean structured layout, scientific diagrammatic style", "color_palette": "{argument name=\"color palette\" default=\"medical red, blue, beige, and anatomical flesh tones\"}", "language": "{argument name=\"language\" default=\"bilingual Chinese and English\"}", "header": { "main_title": "{argument name=\"main title\" default=\"糖尿病诞生的因果链\"}", "english_title": "{argument name=\"english title\" default=\"THE CAUSAL CHAIN OF DIABETES\"}", "subtitle": "从胰岛素失灵,到高血糖,到全身损伤" }, "layout": { "centerpiece": "{argument name=\"central subject\" default=\"transparent human body showing circulatory system and internal organs\"}", "sections_count": 14, "sections": [ { "id": "01", "title": "葡萄糖进入生命", "visuals": ["stomach and intestines"] }, { "id": "02", "title": "胰腺与胰岛素", "visuals": ["pancreas", "beta cell"] }, { "id": "03", "title": "正常胰岛素作用", "visuals": ["receptor signaling diagram", "muscle, liver, adipose icons"] }, { "id": "04", "title": "胰岛素抵抗: 2型通路开始", "visuals": ["receptor blockage diagram", "7 lifestyle icons"] }, { "id": "05", "title": "肝脏持续释放葡萄糖", "visuals": ["liver"] }, { "id": "06", "title": "β细胞衰竭: 代偿到失败", "visuals": ["beta-cell decline line chart"] }, { "id": "07", "title": "1型糖尿病分支", "visuals": ["autoimmune destruction diagram"] }, { "id": "08", "title": "高血糖与血液化学", "visuals": ["blood vessel with glucose", "glucose indicators table", "glucose variability chart"] }, { "id": "09", "title": "高血糖导致组织损伤", "visuals": ["4 pathways of damage diagrams"] }, { "id": "10", "title": "急性代谢后果", "visuals": ["7 symptom icons"] }, { "id": "11", "title": "微血管并发症", "visuals": ["eye", "kidney", "nerve cross-section"] }, { "id": "12", "title": "大血管并发症与组织损伤", "visuals": ["heart", "brain", "diabetic foot"] }, { "id": "13", "title": "器官系统长期代价", "visuals": ["text list"] }, { "id": "14", "title": "糖尿病是调控系统失灵", "visuals": ["metabolic control flowchart"] } ], "footer": { "core_message": "核心信息 CORE MESSAGE" } } }
GPT Image 2 Infographic Visualization Design: Data-Driven UI Graphics
image
GPT Image 2
Jul 5, 2026 awesome-gpt-image-2

GPT Image 2 Infographic Visualization Design: Data-Driven UI Graphics

{ "type": "comprehensive medical infographic", "style": "highly detailed 3D medical illustration, clinical white background, clean typography",...

Prompt Preview

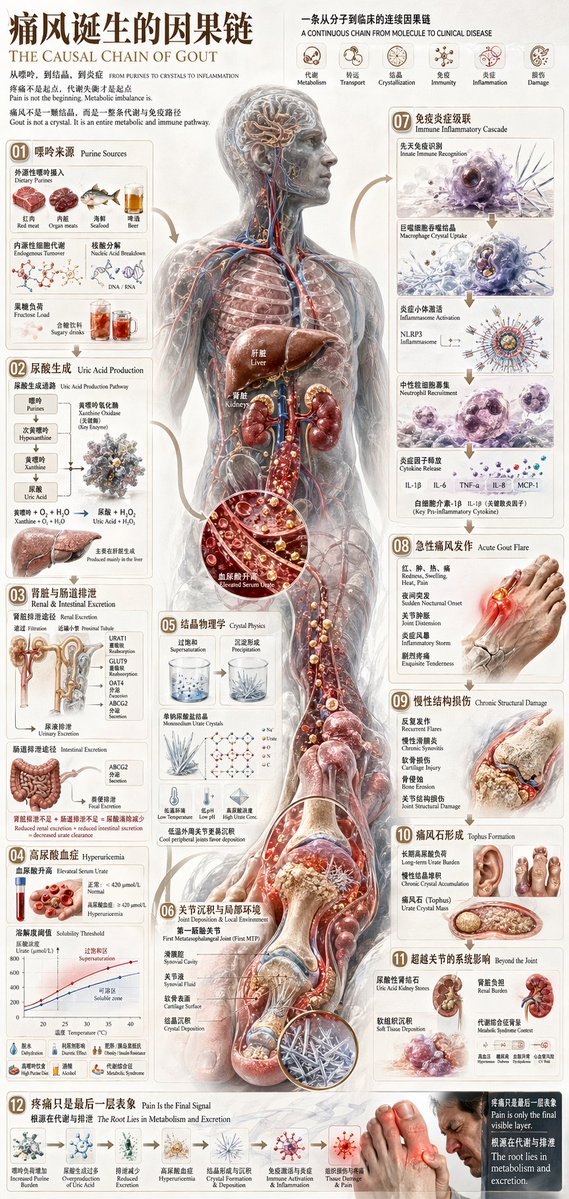
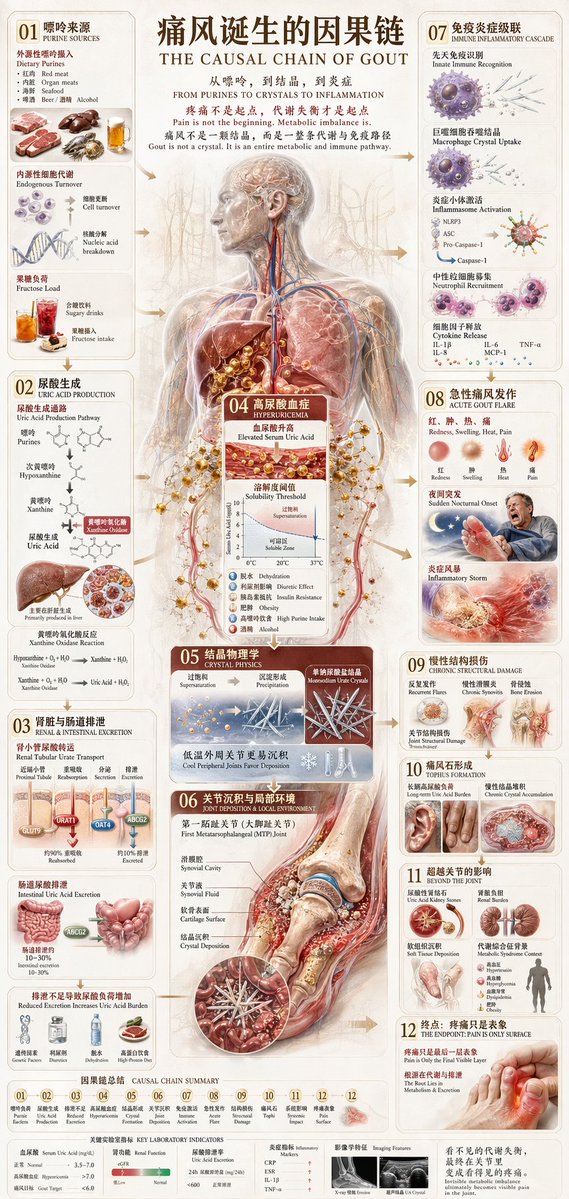
{ "type": "comprehensive medical infographic", "style": "highly detailed 3D medical illustration, clinical white background, clean typography", "header": { "title_cn": "{argument name=\"main title\" default=\"痛风诞生的因果链\"}", "title_en": "{argument name=\"english title\" default=\"THE CAUSAL CHAIN OF GOUT\"}", "subtitle": "Pain is not the beginning. Metabolic imbalance is.", "top_right_sequence": { "count": 6, "labels": ["Metabolism", "Transport", "Crystallization", "Immunity", "Inflammation", "Damage"] } }, "centerpiece": { "description": "{argument name=\"central figure\" default=\"transparent anatomical human body showing liver, kidneys, and vascular system\"}", "details": "pathway highlighted in {argument name=\"highlight color\" default=\"glowing red\"} descending to the foot" }, "layout": { "left_column": [ { "id": "01", "title": "Purine Sources", "elements": 6, "labels": ["Red meat", "Organ meats", "Seafood", "Beer", "Endogenous", "Fructose"] }, { "id": "02", "title": "Uric Acid Production", "elements": 2, "labels": ["Chemical pathway", "Liver"] }, { "id": "03", "title": "Renal & Intestinal Excretion", "elements": 2, "labels": ["Kidney nephron", "Intestines"] }, { "id": "04", "title": "Hyperuricemia", "elements": 2, "labels": ["Blood vial", "Solubility graph"] } ], "center_overlay": [ { "id": "05", "title": "Crystal Physics", "elements": 3, "labels": ["Supersaturation beaker", "Precipitation beaker", "Molecular structure"] }, { "id": "06", "title": "Joint Deposition & Local Environment", "elements": 1, "labels": ["First MTP joint cross-section"] } ], "right_column": [ { "id": "07", "title": "Immune Inflammatory Cascade", "elements": 4, "labels": ["Macrophage", "Inflammasome", "Neutrophil", "Cytokines"] }, { "id": "08", "title": "Acute Gout Flare", "elements": 1, "labels": ["Inflamed foot"] }, { "id": "09", "title": "Chronic Structural Damage", "elements": 1, "labels": ["Bone erosion joint"] }, { "id": "10", "title": "Tophus Formation", "elements": 2, "labels": ["Hand tophi", "Foot tophi"] }, { "id": "11", "title": "Beyond the Joint", "elements": 2, "labels": ["Kidney stones", "Systemic burden"] } ], "bottom_row": [ { "id": "12", "title": "Pain Is the Final Signal", "elements": 7, "labels": ["Increased Purine", "Overproduction", "Reduced Excretion", "Hyperuricemia", "Crystal Formation", "Immune Activation", "Man in pain"] } ] }, "theme": "{argument name=\"disease focus\" default=\"gout and uric acid crystallization\"}" }

GPT Image 2 Infographic Visualization Design: Data-Driven UI Graphics
image
GPT Image 2
Jul 5, 2026 awesome-gpt-image-2

GPT Image 2 Infographic Visualization Design: Data-Driven UI Graphics

{ "type": "comprehensive medical infographic", "style": "highly detailed 3D medical illustration, clinical white background, clean typography",...

Prompt Preview

{ "type": "comprehensive medical infographic", "style": "highly detailed 3D medical illustration, clinical white background, clean typography", "header": { "title_cn": "{argument name=\"main title\" default=\"痛风诞生的因果链\"}", "title_en": "{argument name=\"english title\" default=\"THE CAUSAL CHAIN OF GOUT\"}", "subtitle": "Pain is not the beginning. Metabolic imbalance is.", "top_right_sequence": { "count": 6, "labels": ["Metabolism", "Transport", "Crystallization", "Immunity", "Inflammation", "Damage"] } }, "centerpiece": { "description": "{argument name=\"central figure\" default=\"transparent anatomical human body showing liver, kidneys, and vascular system\"}", "details": "pathway highlighted in {argument name=\"highlight color\" default=\"glowing red\"} descending to the foot" }, "layout": { "left_column": [ { "id": "01", "title": "Purine Sources", "elements": 6, "labels": ["Red meat", "Organ meats", "Seafood", "Beer", "Endogenous", "Fructose"] }, { "id": "02", "title": "Uric Acid Production", "elements": 2, "labels": ["Chemical pathway", "Liver"] }, { "id": "03", "title": "Renal & Intestinal Excretion", "elements": 2, "labels": ["Kidney nephron", "Intestines"] }, { "id": "04", "title": "Hyperuricemia", "elements": 2, "labels": ["Blood vial", "Solubility graph"] } ], "center_overlay": [ { "id": "05", "title": "Crystal Physics", "elements": 3, "labels": ["Supersaturation beaker", "Precipitation beaker", "Molecular structure"] }, { "id": "06", "title": "Joint Deposition & Local Environment", "elements": 1, "labels": ["First MTP joint cross-section"] } ], "right_column": [ { "id": "07", "title": "Immune Inflammatory Cascade", "elements": 4, "labels": ["Macrophage", "Inflammasome", "Neutrophil", "Cytokines"] }, { "id": "08", "title": "Acute Gout Flare", "elements": 1, "labels": ["Inflamed foot"] }, { "id": "09", "title": "Chronic Structural Damage", "elements": 1, "labels": ["Bone erosion joint"] }, { "id": "10", "title": "Tophus Formation", "elements": 2, "labels": ["Hand tophi", "Foot tophi"] }, { "id": "11", "title": "Beyond the Joint", "elements": 2, "labels": ["Kidney stones", "Systemic burden"] } ], "bottom_row": [ { "id": "12", "title": "Pain Is the Final Signal", "elements": 7, "labels": ["Increased Purine", "Overproduction", "Reduced Excretion", "Hyperuricemia", "Crystal Formation", "Immune Activation", "Man in pain"] } ] }, "theme": "{argument name=\"disease focus\" default=\"gout and uric acid crystallization\"}" }

GPT Image 2 App Interface Mockup: Mobile & Desktop UI Design
image
GPT Image 2
Jul 5, 2026 awesome-gpt-image-2

GPT Image 2 App Interface Mockup: Mobile & Desktop UI Design

GPT Image 2 prompt: Generate a vertical mobile phone screenshot style picture with an overall ratio of close to 9:16. In the upper center of the screen is a real cosplayer, playing the two-dimensional character in the uploaded picture. The character is in a realistic style, but his facial features are slightly anime-like, with delicate skin, slightly larger eyes, and a gentle expression looking at the camera. He is sitting in an indoor leisure scene, such as in front of the bar in a cafe or bar. There are props in the background that match the scene. Add the mobile phone system status bar U at the top of the screen...

Prompt Preview

生成一张竖版手机截图风格的图片,整体比例接近 9:16。画面中心偏上是一位真人 coser,扮演上传图片中的二次元角色。人物为写实风格,但五官略带动漫感,皮肤细腻,眼睛稍大,表情温柔地看向镜头,坐在室内的休闲场景中,例如咖啡厅或酒吧吧台前,背景有符合场景的道具。画面最上方加入手机系统状态栏 UI,包括时间、电量、信号、网络等图标,让整张图看起来像手机截图。画面底部叠加一块宽大的半透明 galgame 风格对话框,对话框左侧放一个与画面人物对应的动漫或 Q 版头像;对话框右侧排版文字:第一行用较大字体显示与前面相同的角色名字,下面一到两行显示一段适合这个角色人设的、温柔治愈风格的简体中文台词,由你自动创作。再在对话框下方加一条操作栏,仿照 galgame UI。整体风格高清、细节丰富、光线柔和、二次元与真人写真自然融合。

GPT Image 2 Infographic Visualization Design: Data-Driven UI Graphics
image
GPT Image 2
Jul 5, 2026 awesome-gpt-image-2

GPT Image 2 Infographic Visualization Design: Data-Driven UI Graphics

{ "type": "technical infographic", "subject": "{argument name=\"subject matter\" default=\"digital photography process\"}", "header": { "...

Prompt Preview

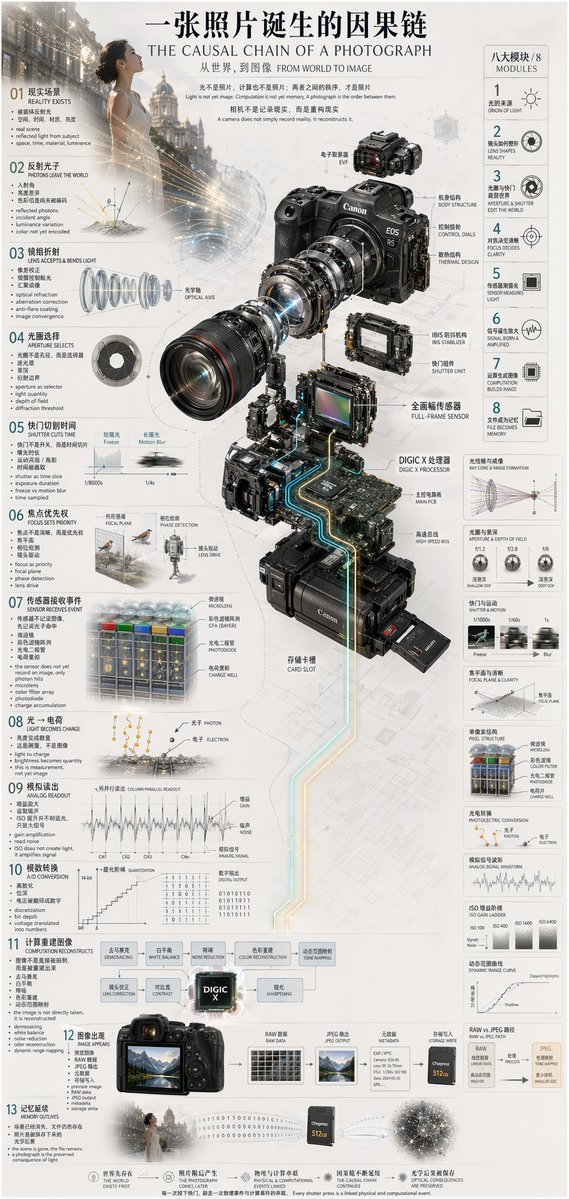
{ "type": "technical infographic", "subject": "{argument name=\"subject matter\" default=\"digital photography process\"}", "header": { "title": "{argument name=\"main title\" default=\"一张照片诞生的因果链 THE CAUSAL CHAIN OF A PHOTOGRAPH\"}", "subtitle": "从世界,到图像 FROM WORLD TO IMAGE" }, "centerpiece": { "description": "Exploded isometric view of a modern mirrorless camera", "model": "{argument name=\"camera model\" default=\"Canon EOS R5\"}", "labeled_parts_count": 12, "labeled_parts": [ "EVF", "Body Structure", "Control Dials", "Thermal Design", "Optical Axis", "IBIS Stabilizer", "Shutter Unit", "Full-Frame Sensor", "{argument name=\"processor name\" default=\"DIGIC X Processor\"}", "Main PCB", "High-Speed Bus", "Card Slot" ] }, "layout": { "left_column": { "description": "Chronological causal chain", "count": 13, "steps": [ "01 REALITY EXISTS", "02 PHOTONS LEAVE THE WORLD", "03 LENS ACCEPTS & BENDS LIGHT", "04 APERTURE SELECTS", "05 SHUTTER CUTS TIME", "06 FOCUS SETS PRIORITY", "07 SENSOR RECEIVES EVENT", "08 LIGHT BECOMES CHARGE", "09 ANALOG READOUT", "10 A/D CONVERSION", "11 COMPUTATION RECONSTRUCTS", "12 IMAGE APPEARS", "13 MEMORY OUTLIVES" ] }, "right_column": { "title": "八大模块 / 8 MODULES", "count": 8, "modules": [ "1 ORIGIN OF LIGHT", "2 LENS SHAPES REALITY", "3 APERTURE & SHUTTER EDIT THE WORLD", "4 FOCUS DECIDES CLARITY", "5 SENSOR MEASURES LIGHT", "6 SIGNAL BORN & AMPLIFIED", "7 COMPUTATION BUILDS IMAGE", "8 FILE BECOMES MEMORY" ] }, "side_diagrams": { "count": 7, "descriptions": [ "Ray cone & image formation", "Aperture & depth of field", "Shutter & motion", "Focal plane & clarity", "Pixel structure", "Photoelectric conversion", "Analog signal waveform" ] }, "footer": { "count": 5, "description": "Philosophical summary points" } }, "style": "technical, precise, wireframe elements, glowing data lines, photorealistic camera components, clean typography, dual-language" }

GPT Image 2 Relationship Graph Infographic: Network Data Visualization
image
GPT Image 2
Jul 5, 2026 awesome-gpt-image-2

GPT Image 2 Relationship Graph Infographic: Network Data Visualization

GPT Image 2 prompt: { "type": "technical infographic and exploded view diagram", "header": { "title": "{argument name=\"main title\" default=\"Canon EOS R5 imaging system cross-section...

Prompt Preview

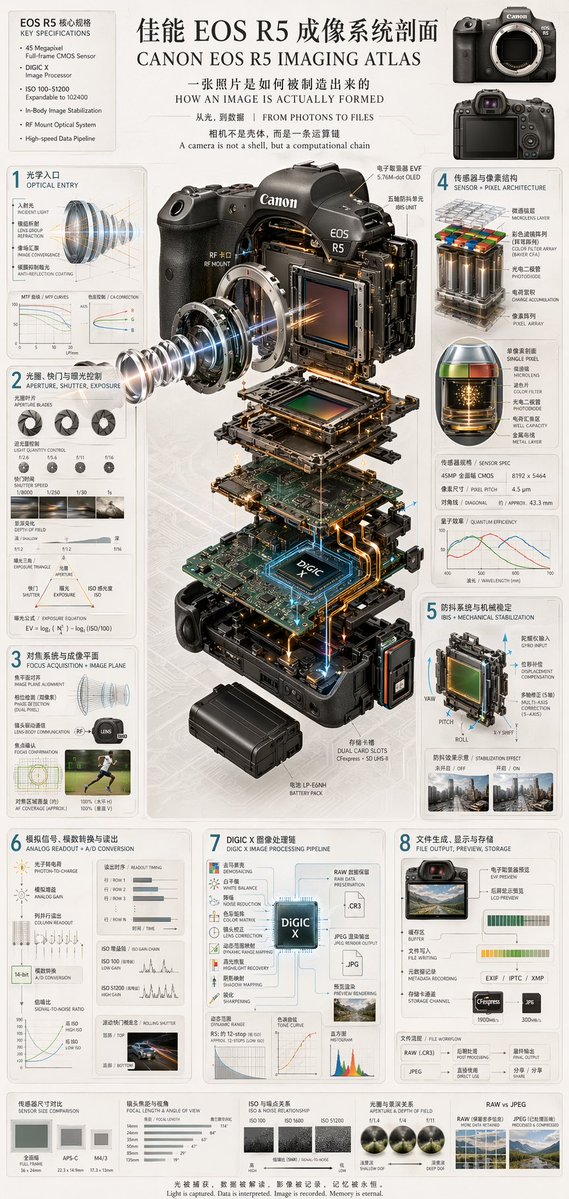
{ "type": "technical infographic and exploded view diagram", "header": { "title": "{argument name=\"main title\" default=\"佳能 EOS R5 成像系统剖面 CANON EOS R5 IMAGING ATLAS\"}", "subtitles": [ "一张照片是如何被制造出来的 HOW AN IMAGE IS ACTUALLY FORMED", "从光,到数据 | FROM PHOTONS TO FILES", "相机不是壳体,而是一条运算链 A camera is not a shell, but a computational chain" ], "top_left_box": { "title": "EOS R5 核心规格 KEY SPECIFICATIONS", "bullet_points_count": 6 }, "top_right_images": { "count": 2, "description": "front and back views of the camera body" } }, "centerpiece": { "description": "highly detailed 3D exploded view of the {argument name=\"camera model\" default=\"Canon EOS R5\"} camera, showing internal components separated vertically", "components_visible": [ "lens mount", "lens elements with glowing blue light rays", "image sensor", "motherboard with glowing {argument name=\"processor name\" default=\"DIGIC X\"} chip", "battery pack", "dual card slots", "electronic viewfinder (EVF)" ] }, "layout": { "numbered_sections": [ { "number": 1, "title": "光学入口 OPTICAL ENTRY", "elements": ["lens cross-section with light rays", "2 line graphs"] }, { "number": 2, "title": "光圈、快门与曝光控制 APERTURE, SHUTTER, EXPOSURE", "elements": ["3 aperture blade diagrams", "4 shutter speed example photos", "depth of field diagram", "exposure triangle diagram"] }, { "number": 3, "title": "对焦系统与成像平面 FOCUS ACQUISITION + IMAGE PLANE", "elements": ["lens alignment diagram", "AF coverage photo of a runner"] }, { "number": 4, "title": "传感器与像素结构 SENSOR + PIXEL ARCHITECTURE", "elements": ["3D pixel array diagram", "single pixel cross-section diagram", "sensor spec table", "quantum efficiency graph"] }, { "number": 5, "title": "防抖系统与机械稳定 IBIS + MECHANICAL STABILIZATION", "elements": ["sensor shift mechanism diagram with yaw/pitch/roll axes", "2 stabilization effect comparison photos"] }, { "number": 6, "title": "模拟信号、模数转换与读出 ANALOG READOUT + A/D CONVERSION", "elements": ["signal flowchart", "3 readout timing graphs", "signal-to-noise ratio graph", "rolling shutter example photo of a car"] }, { "number": 7, "title": "DIGIC X 图像处理链 DIGIC X IMAGE PROCESSING PIPELINE", "elements": ["processing flowchart with central chip", "dynamic range graph", "tone curve graph", "histogram"] }, { "number": 8, "title": "文件生成、显示与存储 FILE OUTPUT, PREVIEW, STORAGE", "elements": ["file output flowchart", "2 storage card icons", "file workflow diagram"] } ], "bottom_comparisons": { "count": 5, "labels": [ "传感器尺寸对比 SENSOR SIZE COMPARISON", "镜头焦距与视角 FOCAL LENGTH & ANGLE OF VIEW", "ISO 与噪点关系 ISO & NOISE RELATIONSHIP", "光圈与景深关系 APERTURE & DEPTH OF FIELD", "RAW vs JPEG" ] }, "footer": "{argument name=\"footer quote\" default=\"光被捕获,数据被解读,影像被记录,记忆被永恒。 Light is captured. Data is interpreted. Image is recorded. Memory is eternal.\"}" }, "style": "clean, technical, highly detailed, photorealistic components, blueprint-style annotations, light gray background, precise typography" }

GPT Image 2 Infographic Visualization Design: Data-Driven UI Graphics
image
GPT Image 2
Jul 5, 2026 awesome-gpt-image-2

GPT Image 2 Infographic Visualization Design: Data-Driven UI Graphics

{ "type": "scientific botanical infographic poster", "subject": "{argument name=\"plant species\" default=\"Pomegranate (Punica granatum)\"}", ...

Prompt Preview

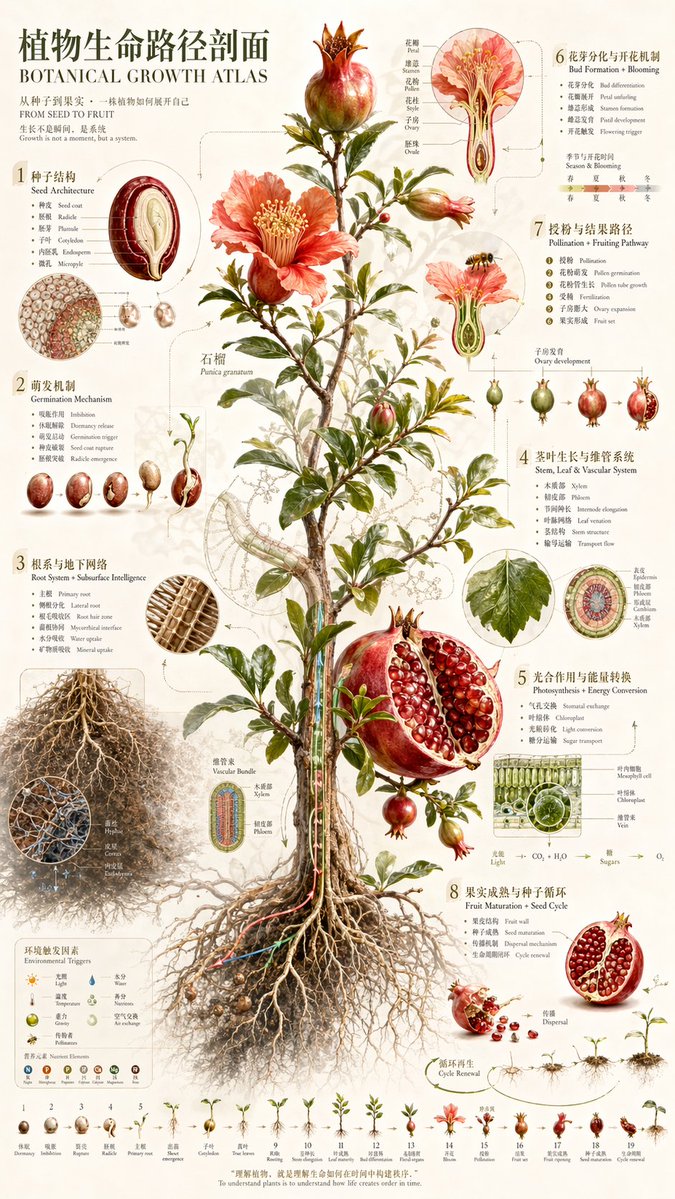
{ "type": "scientific botanical infographic poster", "subject": "{argument name=\"plant species\" default=\"Pomegranate (Punica granatum)\"}", "style": "vintage botanical illustration mixed with modern infographic design, highly detailed, {argument name=\"color palette\" default=\"earthy greens, deep reds, parchment background\"}", "header": { "main_title": "{argument name=\"main title\" default=\"植物生命路径剖面\"}", "english_title": "{argument name=\"english title\" default=\"BOTANICAL GROWTH ATLAS\"}", "subtitle": "从种子到果实,一株植物如何展开自己 / FROM SEED TO FRUIT" }, "centerpiece": "full plant showing extensive root system, woody stem, green leaves, blooming red flowers, and ripe fruits including one halved to show seeds", "layout": { "numbered_sections": [ { "number": 1, "title": "种子结构 / Seed Architecture", "content": "cross-section of a single seed with 6 labeled parts" }, { "number": 2, "title": "萌发机制 / Germination Mechanism", "content": "sequence of 5 sprouting seeds showing radicle emergence" }, { "number": 3, "title": "根系与地下网络 / Root System + Subsurface Intelligence", "content": "detailed root network with 2 circular microscopic cross-sections showing vascular bundles and hyphae" }, { "number": 4, "title": "茎叶生长与维管系统 / Stem, Leaf & Vascular System", "content": "leaf detail and circular stem cross-section with 5 labeled layers" }, { "number": 5, "title": "光合作用与能量转换 / Photosynthesis + Energy Conversion", "content": "3D cellular cross-section of a leaf showing mesophyll and chloroplasts, plus a chemical equation diagram" }, { "number": 6, "title": "花芽分化与开花机制 / Bud Formation + Blooming", "content": "detailed flower cross-section showing stamen and ovary, plus a 4-season timeline" }, { "number": 7, "title": "授粉与结果路径 / Pollination + Fruiting Pathway", "content": "bee approaching a flower cross-section, followed by a sequence of 5 stages of ovary development into a fruit" }, { "number": 8, "title": "果实成熟与种子循环 / Fruit Maturation + Seed Cycle", "content": "ripe fruit breaking open, seeds dispersing downwards to a new sprout" } ], "additional_elements": [ { "position": "bottom left", "title": "环境触发因素 / Environmental Triggers", "content": "grid of 6 weather/environmental icons and 6 nutrient element icons (N, P, K, Ca, Mg, Fe)" }, { "position": "bottom edge", "title": "Growth Timeline", "content": "linear sequence of 19 small plant icons showing the complete life cycle from seed to mature plant" } ], "footer_quote": "{argument name=\"bottom quote\" default=\"理解植物,就是理解生命如何在时间中构建秩序。\"}" } }

GPT Image 2 Infographic Visualization Design: Data-Driven UI Graphics
image
GPT Image 2
Jul 5, 2026 awesome-gpt-image-2

GPT Image 2 Infographic Visualization Design: Data-Driven UI Graphics

{ "type": "complex urban systems atlas infographic", "style": "{argument name=\"color palette\" default=\"dark background with glowing blue, go...

Prompt Preview

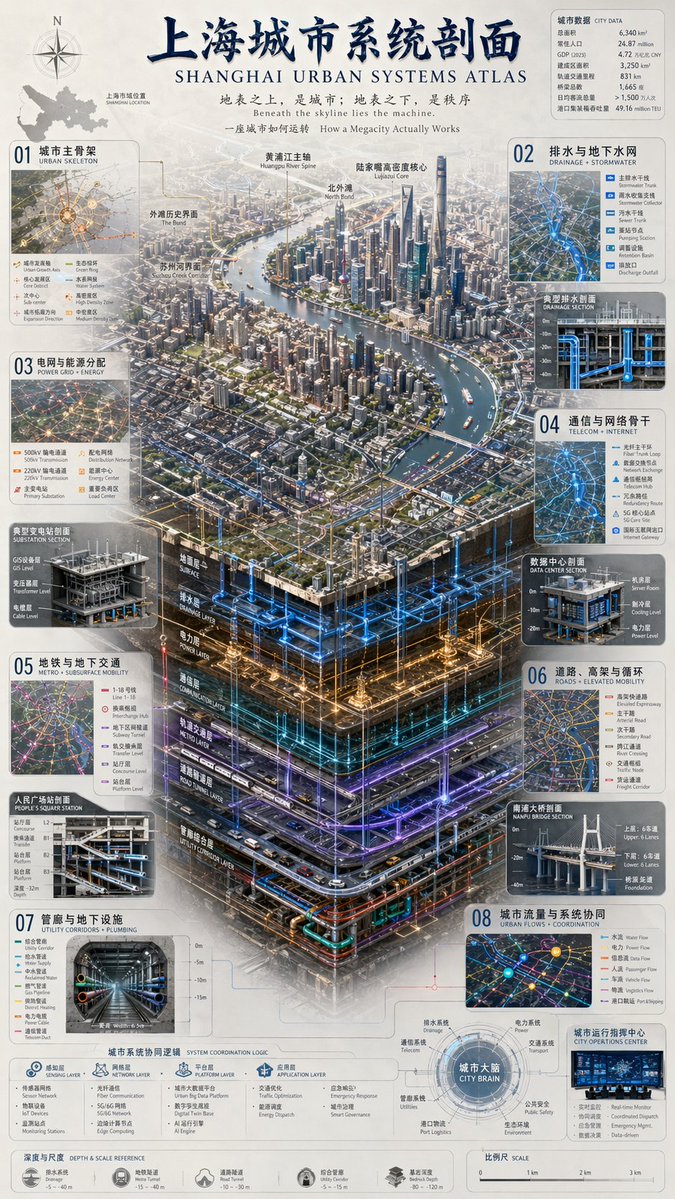
{ "type": "complex urban systems atlas infographic", "style": "{argument name=\"color palette\" default=\"dark background with glowing blue, gold, and purple accents\"}, highly detailed technical illustration, 3D isometric cutaway", "header": { "title": "{argument name=\"chinese city name\" default=\"上海\"}城市系统剖面 {argument name=\"english city name\" default=\"SHANGHAI\"} URBAN SYSTEMS ATLAS", "subtitles": [ "地表之上,是城市;地表之下,是秩序 {argument name=\"english subtitle\" default=\"Beneath the skyline lies the machine.\"}", "一座城市如何运转 How a Megacity Actually Works" ] }, "layout": { "top_left": "Compass rose and city map labeled '上海市域位置 SHANGHAI LOCATION'", "top_right": "Data table titled '城市数据 CITY DATA' with 7 rows of statistics", "centerpiece": { "description": "{argument name=\"centerpiece style\" default=\"highly detailed 3D isometric cutaway render\"} of a megacity river landscape", "layers": [ "地面层 SURFACE", "排水层 DRAINAGE LAYER", "电力层 POWER LAYER", "通信层 COMMUNICATION LAYER", "轨道交通层 METRO LAYER", "道路隧道层 ROAD TUNNEL LAYER", "管廊综合层 UTILITY CORRIDOR LAYER" ] }, "side_panels": [ { "id": "01", "title": "城市主骨架 URBAN SKELETON", "elements": "Map with 8 legend items" }, { "id": "02", "title": "排水与地下水网 DRAINAGE + STORMWATER", "elements": "Cross-section diagram '典型排水剖面 DRAINAGE SECTION' with 5 legend items" }, { "id": "03", "title": "电网与能源分配 POWER GRID + ENERGY", "elements": "Cross-section diagram '典型变电站剖面 SUBSTATION SECTION' with 6 legend items" }, { "id": "04", "title": "通信与网络骨干 TELECOM + INTERNET", "elements": "Cross-section diagram '数据中心剖面 DATA CENTER SECTION' with 6 legend items" }, { "id": "05", "title": "地铁与地下交通 METRO + SUBSURFACE MOBILITY", "elements": "Cross-section diagram '人民广场站剖面 PEOPLE'S SQUARE STATION' with 6 legend items" }, { "id": "06", "title": "道路、高架与循环 ROADS + ELEVATED MOBILITY", "elements": "Cross-section diagram '南浦大桥剖面 NANPU BRIDGE SECTION' with 6 legend items" }, { "id": "07", "title": "管廊与地下设施 UTILITY CORRIDORS + PLUMBING", "elements": "Cross-section diagram '综合管廊 UTILITY CORRIDOR' with 8 legend items" }, { "id": "08", "title": "城市流量与系统协同 URBAN FLOWS + COORDINATION", "elements": "Map diagram '城市运行指挥中心 CITY OPERATIONS CENTER' with 6 legend items" } ], "bottom_panels": { "system_logic": { "title": "城市系统协同逻辑 SYSTEM COORDINATION LOGIC", "steps": 4, "labels": ["感知层 SENSING LAYER", "网络层 NETWORK LAYER", "平台层 PLATFORM LAYER", "应用层 APPLICATION LAYER"] }, "city_brain": { "title": "城市大脑 CITY BRAIN", "central_node": 1, "peripheral_nodes": 8 }, "references": { "depth_scale": { "title": "深度与尺度 DEPTH & SCALE REFERENCE", "icons": 5 }, "map_scale": { "title": "比例尺 SCALE", "markers": 4 } } } } }

GPT Image 2 Relationship Graph Infographic: Network Data Visualization
image
GPT Image 2
Jul 5, 2026 awesome-gpt-image-2

GPT Image 2 Relationship Graph Infographic: Network Data Visualization

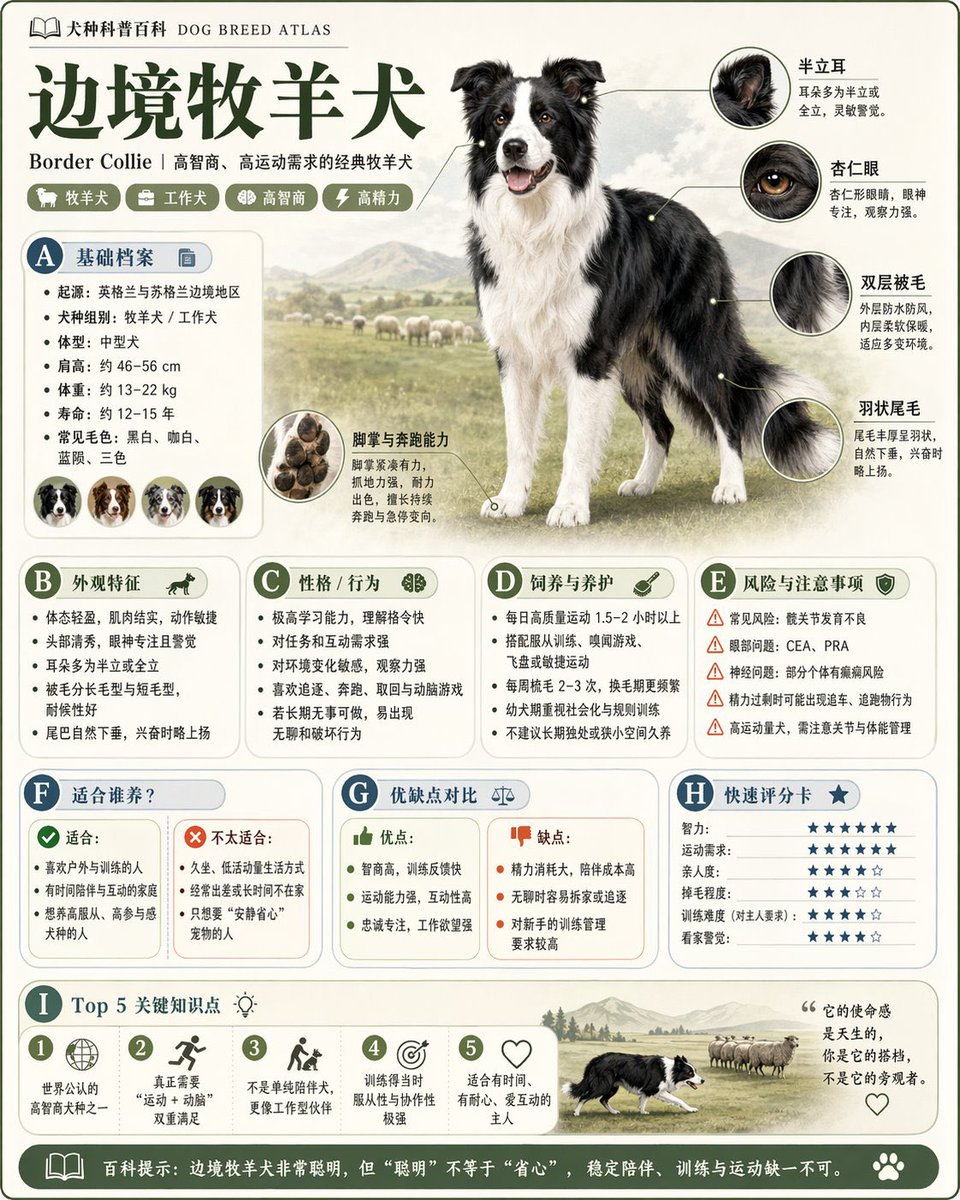
Please generate a high-quality vertical "Popular Science Encyclopedia Image" based on {argument name="theme" default="animals"}. This image is not...

Prompt Preview

Please generate a high-quality vertical "Popular Science Encyclopedia Image" based on {argument name="theme" default="animals"}. This image is not a regular poster or a simple illustration, but a modular popular science infographic that possesses a sense of "illustration book, encyclopedia, information structure, and collectability." The overall style should reference a combination of high-end natural history illustrations, modern encyclopedia pages, lifestyle knowledge cards, and highly shareable social media infographics. Please include in the frame: - A clear and beautiful main visual of the subject - Several magnified details of local characteristics - Multiple rounded modular information sections - Clear title hierarchies and key labels - Concise yet rich encyclopedic content - Visual ratings, key point summaries, or Top 5 modules Content columns should be automatically adapted based on the theme, prioritized from these directions: basic profile, classification information, appearance characteristics, habits/ecology, formation mechanism/structure, growth or use conditions, care or maintenance suggestions, risks and precautions, suitable audience or scenarios, pros and cons comparison, and quick rating cards. Visual requirements: Light-colored clean background, soft color palette, light shadows, exquisite small icons, rounded information boxes, neat layout, high information density but not crowded, good reading experience. The overall result must look like a real science encyclopedia card suitable for publishing, reading, collecting, and serialized production, rather than an advertisement. Please do not make it a regular commercial promotional poster. Highlight the features of "knowledge organization + modular information + illustration-style display."

Previous Page 61 of 632 Next